Introduction
Graphs can be used to analyze data related to motion. To do this, you must first establish where it is going, how fast it is going, how far it has gone, and it's speed. In this lab, we used a motion detector to plot the graphs for each of these characteristics. A motion detector measures the change in distance and velocity of an object. Afterwards, it takes this information and sticks it on a graph. By analyzing, you can grasp a better understanding of kinematics.
Purpose
• Analyze the motion of a student walking across the room
• To predict, sketch, and test velocity vs time and position vs time kinematics graphs
Materials
LabQuest, LabQuest App, Motion Detector, Meter Stick, Masking Tape
Data
Conclusion
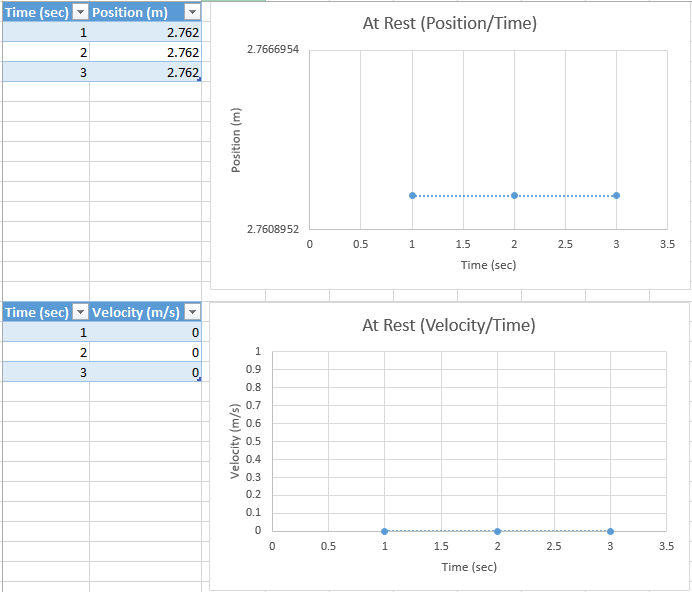
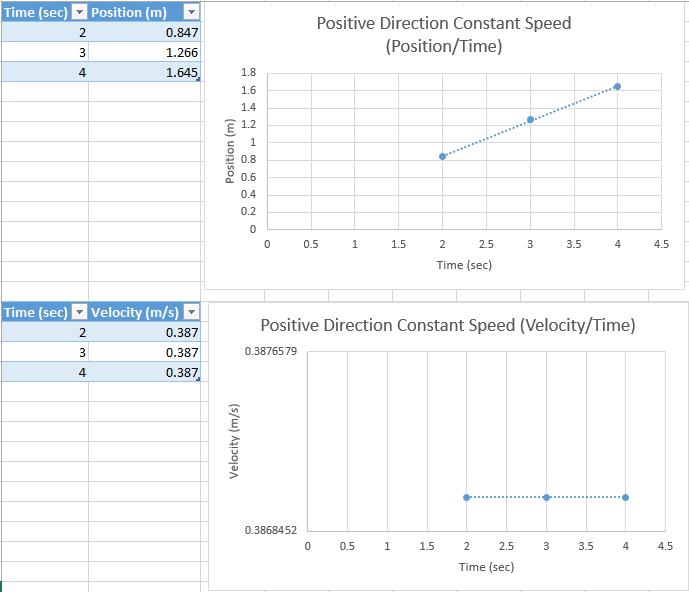
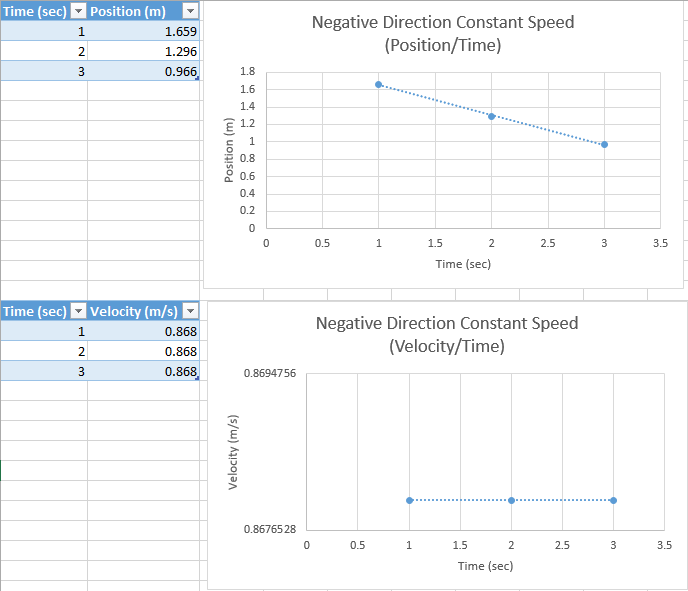
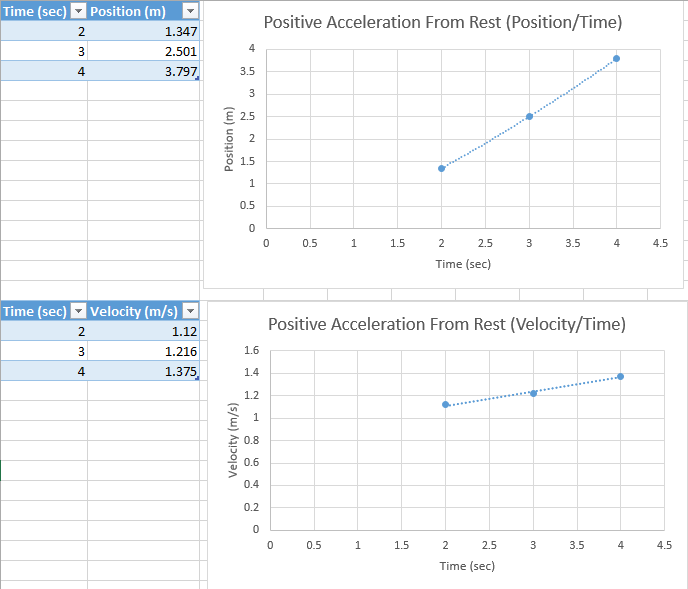
The purpose of this lab was to analyze the motion of a student, and we found that the motion of a student affects the velocity of a graph. The first graph represents a student standing still (or at least as still as possible). The second graph also represents the velocity of a student standing still. The third and fourth graphs display the position and velocity of a student moving backwards at a constant speed in relation to time. The fifth and sixth graphs represent the velocity and position of a student moving forward at a constant speed in relation to time.
The purpose of this lab was to analyze the motion of a student, and we found that the motion of a student affects the velocity of a graph. The first graph represents a student standing still (or at least as still as possible). The second graph also represents the velocity of a student standing still. The third and fourth graphs display the position and velocity of a student moving backwards at a constant speed in relation to time. The fifth and sixth graphs represent the velocity and position of a student moving forward at a constant speed in relation to time.
