Purpose
- Collect distance, velocity, and acceleration data as a cart rolls up and down a ramp.
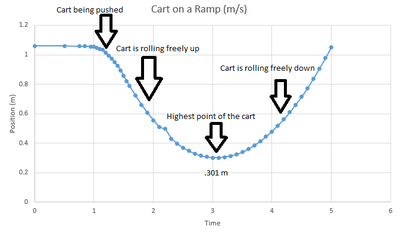
- Analyze the position vs. time, velocity vs. time, and acceleration vs. time graphs.
- Determine the best fit equations for the distance vs. time and velocity vs. time graphs.
- Determine the mean acceleration from the acceleration from the acceleration vs. time graph.
Materials
LabQuest, LabQuest App, Motion Detector, Motion Detector Bracket, Track, Dynamics Cart
Procedure
1. Prepare the track and Motion Detector for data collection.
a. Attach the Motion Detector Bracket to the track (see Figure 1).
b. Attach the Motion Detector to the Motion Detector Bracket.
c. Adjust the position of the Motion Detector Bracket so the Motion Detector is 0.15 m from the end of the track.
d. Set the switch on the Motion Detector to the Track position.
2. Connect the Motion Detector to DIG 1 of LabQuest and choose New from the File menu.
3. Place the cart on the track near the bottom end stop. If your cart has a plunger, face the plunger away from the Motion Detector. Start data collection. You will notice a clicking sound from the Motion Detector. Wait about a second, then briefly push the cart up the ramp, letting it roll freely up nearly to the top, and then back down. Catch the cart as it nears the end stop.
4. Examine the position vs. time graph. Repeat Step 3 if your position vs. time graph does not show an area of smoothly changing distance. Check with your instructor if you are not sure whether you need to repeat data collection.
Data/Analysis
- Collect distance, velocity, and acceleration data as a cart rolls up and down a ramp.
- Analyze the position vs. time, velocity vs. time, and acceleration vs. time graphs.
- Determine the best fit equations for the distance vs. time and velocity vs. time graphs.
- Determine the mean acceleration from the acceleration from the acceleration vs. time graph.
Materials
LabQuest, LabQuest App, Motion Detector, Motion Detector Bracket, Track, Dynamics Cart
Procedure
1. Prepare the track and Motion Detector for data collection.
a. Attach the Motion Detector Bracket to the track (see Figure 1).
b. Attach the Motion Detector to the Motion Detector Bracket.
c. Adjust the position of the Motion Detector Bracket so the Motion Detector is 0.15 m from the end of the track.
d. Set the switch on the Motion Detector to the Track position.
2. Connect the Motion Detector to DIG 1 of LabQuest and choose New from the File menu.
3. Place the cart on the track near the bottom end stop. If your cart has a plunger, face the plunger away from the Motion Detector. Start data collection. You will notice a clicking sound from the Motion Detector. Wait about a second, then briefly push the cart up the ramp, letting it roll freely up nearly to the top, and then back down. Catch the cart as it nears the end stop.
4. Examine the position vs. time graph. Repeat Step 3 if your position vs. time graph does not show an area of smoothly changing distance. Check with your instructor if you are not sure whether you need to repeat data collection.
Data/Analysis
Conclusion
1. How closely does the slope correspond to the acceleration you found in the previous step? (Compare the slope from the velocity graph and the value from the acceleration graph.)
Acceleration value = 0.429 m/s^2
Slope = 0.42346
They're very close.
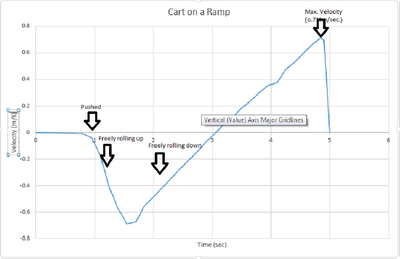
2. What was the velocity of the cart at the top of its motion?
It doesn't have a velocity at the top of its motion. It stops at the top.
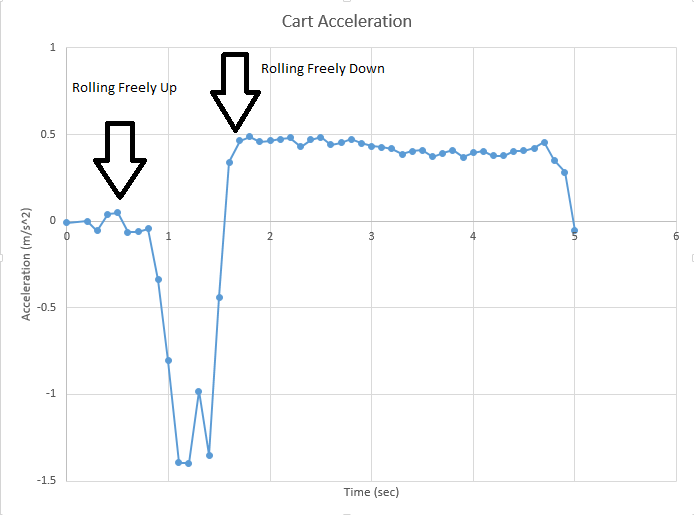
3. What was the acceleration of the cart at the top of its motion?
It doesn't have an acceleration at the top of its motion because it stops at the top.
4. Is the cart's acceleration constant during the free-rolling segment?
Yes.
5. Review your preliminary questions, based on your new knowledge do you still agree with you prediction? Why or why not?
I agree with my sketches of the position vs. time graph and the velocity vs. time graph. They both look very close to the graph. My acceleration vs. time sketch doesn't really look like the graph.
6. Explain what the meaning of the equation that you found for the velocity time graph. Label each variable and explain what the meaning of the slope is.
The meaning of the equation found for the velocity time graph is a way to predict data points. It shows our slope and y-intercept.
y = .42346x - 1.314
slope = .42346
y-intercept = -1.314
7. Predict what the position vs. time, velocity vs. time, and the acceleration vs. time would be for an object that was falling straight down, rather than being on an incline.
It would be the second half of all the graphs.
1. How closely does the slope correspond to the acceleration you found in the previous step? (Compare the slope from the velocity graph and the value from the acceleration graph.)
Acceleration value = 0.429 m/s^2
Slope = 0.42346
They're very close.
2. What was the velocity of the cart at the top of its motion?
It doesn't have a velocity at the top of its motion. It stops at the top.
3. What was the acceleration of the cart at the top of its motion?
It doesn't have an acceleration at the top of its motion because it stops at the top.
4. Is the cart's acceleration constant during the free-rolling segment?
Yes.
5. Review your preliminary questions, based on your new knowledge do you still agree with you prediction? Why or why not?
I agree with my sketches of the position vs. time graph and the velocity vs. time graph. They both look very close to the graph. My acceleration vs. time sketch doesn't really look like the graph.
6. Explain what the meaning of the equation that you found for the velocity time graph. Label each variable and explain what the meaning of the slope is.
The meaning of the equation found for the velocity time graph is a way to predict data points. It shows our slope and y-intercept.
y = .42346x - 1.314
slope = .42346
y-intercept = -1.314
7. Predict what the position vs. time, velocity vs. time, and the acceleration vs. time would be for an object that was falling straight down, rather than being on an incline.
It would be the second half of all the graphs.
